
Performance of Flags, Pennants, Triangles, and Wedges in the Cryptocurrency Markets (BTC Traded Pairs)
Be sure to read the Methodology section under the “Proof of Work” header and the FAQ before you interpret the performance stats!
For numerous additional performance statistics and insights, please read the Chart Logic Technical Analysis Handbook.
Remember: These are DAILY (1D) candle statistics for swing and position traders. Intraday or other short-term price action movements are not relevant to these statistics! Combined averages (USD(T) & BTC traded pairs) are available exclusively for handbook readers.
Flags
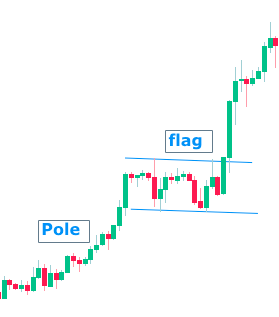
XMR/USD (TradingView chart)
Bull Flag
A short-term continuation biased pattern marked by a rectangular or parallelogram consolidation (flag) following a bullish run-up (pole).
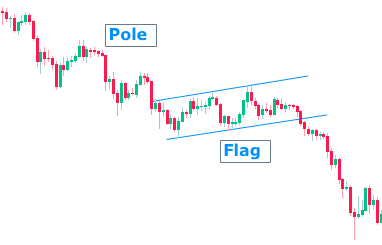
ETH/USD (TradingView chart)
Bear Flag
A short-term continuation biased pattern marked by a rectangular or parallelogram consolidation (flag) following a bearish downtrend (pole).
Performance Results
Number of examined Flags = 426
Trend Continuation % for Bull Flags = 86%
Trend Continuation % for Bear Flags = 90.5%
Unfiltered Avg. % gain from upside breakout = 83%
Avg. % decline from downside breakdown = -33.5%
Filtered Avg. % gain from upside breakout (excluding outliers over 400%) = 78%
Filtered Avg. % gain from upside breakout (excluding gainers over 100%) = 43%
Pennants

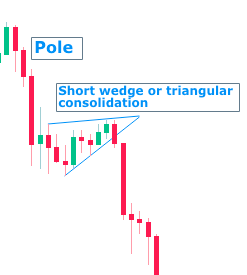
LTC/USD (TradingView chart)
Bull Pennant
A short-term continuation biased pattern marked by a upward flag pole and triangular or wedgy consolidation. Under 21 days of formation otherwise it’s a triangle or wedge.
LTC/USD (TradingView chart)
Bear Pennant
A short-term continuation biased pattern marked by a downward flag pole and triangular or wedgy consolidation. Under 21 days of formation otherwise it’s a triangle or wedge.
Performance Results
Number of examined Pennants = 427
Trend Continuation % for Bull Pennants = 67%
Trend Continuation % for Bear Pennants = 85%
Unfiltered Avg. % gain from upside breakout = 96%
Avg. % decline from downside breakdown = -29%
Filtered Avg. % gain from upside breakout (excluding outliers over 400%) = 78.5%
Filtered Avg. % gain from upside breakout (excluding gainers over 100%) = 48.5%
Triangles

WAVES/BTC (TradingView chart)
Ascending Triangle
A triangular consolidation pattern with a series of higher lows rising against a flat or nearly flat resistance line. Formed over 21+ days with at least five touches on the resistance and support line.
Performance Results
Number of examined Ascending Triangles = 45
Upside Breakout % = 58%
Downside Breakdown % = 42%
Trend Continuation (Preceding Bullish Trend) = 90%
Trend Continuation (Preceding Bearish Trend) = 58.5%
Unfiltered Avg. % gain from upside breakout = 148.5%
Avg. % decline from downside breakdown = -37.5%
Filtered Avg. % gain from upside breakout (excluding outliers over 400%) = 101%
Filtered Avg. % gain from upside breakout (excluding gainers over 100%) = 46.5%
ETH/XBT (TradingView chart)
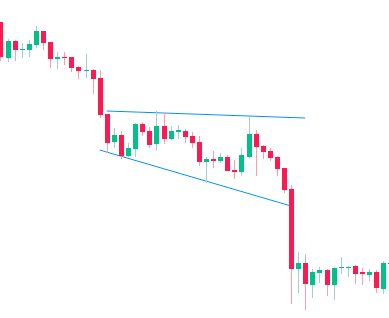
Descending Triangle
A triangular consolidation pattern with a series of lower highs trending downward against a flat or nearly flat support line. Formed over 21+ days with at least five touches on the resistance and support line.
Performance Results
Number of examined Descending Triangles = 99
Upside Breakout % = 33.5%
Downside Breakdown % = 66.5%
Trend Continuation (Preceding Bullish Trend) = 38%
Trend Continuation (Preceding Bearish Trend) = 72.5%
Unfiltered Avg. % gain from upside breakout = 130%
Avg. % decline from downside breakdown = -37%
Filtered Avg. % gain from upside breakout (excluding outliers over 400%) = 64.5%
Filtered Avg. % gain from upside breakout (excluding gainers over 100%) = 49.5%
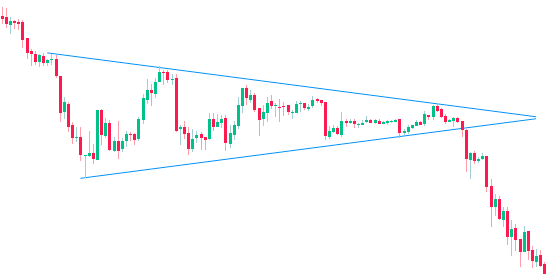
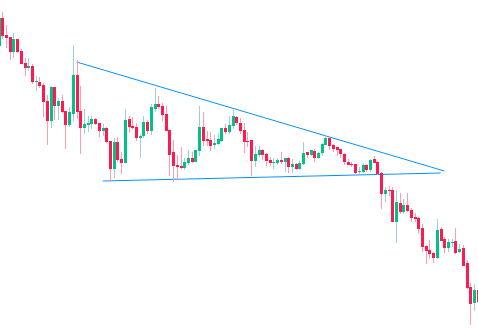
Symmetrical Triangle
.A triangular consolidation pattern with a series of converging highs and lows. Formed over 21+ days with at least five touches on the resistance and support line.
Performance Results
Number of examined Symmetrical Triangles = 178
Upside Breakout % = 28.5%
Downside Breakdown % = 71.5%
Trend Continuation (Preceding Bullish Trend) = 32.5%
Trend Continuation (Preceding Bearish Trend) = 76%
Unfiltered Avg. % gain from upside breakout = 133%
Avg. % decline from downside breakdown = -43%
Filtered Avg. % gain from upside breakout (excluding outliers over 400%) = 72.5%
Filtered Avg. % gain from upside breakout (excluding gainers over 100%) = 48%
ESO/USD (TradingView chart)
Wedges
MANA/USDT (TradingView chart)
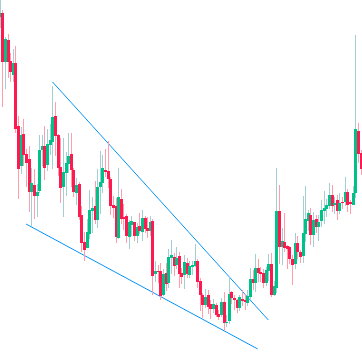
Falling Wedge
A triangular pattern marked by lower highs and lower lows that converge toward a point. Falling wedges can be both a continuation and reversal pattern; however, they are more likely to break upward than down.
Performance Results
Number of examined Falling Wedges = 97
Upside Breakout % = 79%
Downside Breakdown % = 21%
Trend Continuation (Preceding Bullish Trend) = 79.5%
Trend Continuation (Preceding Bearish Trend) = 19.5%
Unfiltered Avg. % gain from upside breakout = 111.5%
Avg. % decline from downside breakdown = -34%
Filtered Avg. % gain from upside breakout (excluding outliers over 400%) = 87%
Filtered Avg. % gain from upside breakout (excluding gainers over 100%) = 44%
BTC/USD (TradingView chart)
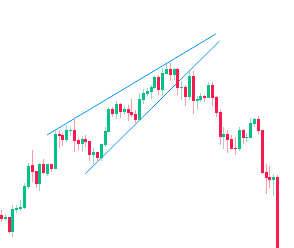
Rising Wedge
A triangular pattern marked by higher highs and higher lows that converge toward a point. Rising wedges can be both a continuation and reversal pattern; however, they are more likely to break downward than up.
Performance Results
Number of examined Rising Wedges = 56
Upside Breakout % = 14%
Downside Breakdown % = 86%
Trend Continuation (Preceding Bullish Trend) = 15%
Trend Continuation (Preceding Bearish Trend) = 82.5%
Unfiltered Avg. % gain from upside breakout = 91.5%
Avg. % decline from downside breakdown = -44%
Filtered Avg. % gain from upside breakout (excluding outliers over 400%) = 91.5%
Filtered Avg. % gain from upside breakout (excluding gainers over 100%) = 42%

ADA/BTC (TradingView chart)
Broadening Wedge (ascending)
BNB/USDT (TradingView chart)
Broadening Wedge (descending)
Performance Results
Number of examined Broadening Wedges = 57
Upside Breakout % = 31.5%
Downside Breakdown % = 68.5%
Bullish Trend Continuation % for Ascending Wedges = 47%
Bearish Trend Continuation % for Ascending Wedges = 84%
Bullish Trend Continuation % for Descending Wedges = 65%
Bearish Trend Continuation % for Descending Wedges = 50%
Unfiltered Avg. % gain from upside breakout = 89.5%
Avg. % decline from downside breakdown = -37.5%
Filtered Avg. % gain from upside breakout (excluding outliers over 400%) = 69%
Filtered Avg. % gain from upside breakout (excluding gainers over 100%) = 43%